Agreement A in R
Ordered rating scales are a common format in surveys, and often we are interested in the extent to which responses are in agreement (whether there is consensus, whether there is concentration among the responses, or by contrast whether there is dispersion or polarization). Standard deviations are commonly considered an inappropriate measure in this situation. Van der Eijk's measure of agreement A disaggregates frequency distributions into component parts called layers. At the level of these layers, agreement can easily be determined, and the measure of agreement provides the weighted average.
We can use the example provided by van der Eijk (p.331) to illustrate the use of layers.
| Position on rating scale | 1 | 2 | 3 | 4 | 5 | 6 | 7 |
|---|---|---|---|---|---|---|---|
| Observed frequencies | 30 | 40 | 210 | 130 | 530 | 50 | 10 |
The measure of agreement divides this into layers, starting with the lowest observed frequencies. The level of agreement for this layer is calculated, and weighted by the number of observations in this layer. This is repeated for all layers, using any additional observations, until we reach the highest observed frequencies. For the first layer, there are 10 observations for each position. The agreement of the level is calculated as A = 1 - (S-1)/(K-1), where S is the number of non-empty categories on a layer, and K is the number of categories in the frequency vector overall. In the first layer, there are 7 non-empty categories (the pattern consists of 1 only). This gives a level of agreement of 0 for this level.
The weight of the level is the number of observations in this layer (7 categories * 10 observations = 70) divided by the total number of observations in the frequency vector (1000). For the second layer, we have already used all 10 observations for position 7, so a 0 will be added. the second lowest frequency is the 20 left for position 1. The level of agreement for the second layer is 0.17 (S=6 non-empty categories, K=7 categories overall), with a weight of 0.12.
| 1 | 2 | 3 | 4 | 5 | 6 | 7 | Agreement of layer | Pattern | Weight | |
|---|---|---|---|---|---|---|---|---|---|---|
| Layer 1 | 10 | 10 | 10 | 10 | 10 | 10 | 10 | 0 | 1111111 | 0.07 |
| Layer 2 | 20 | 20 | 20 | 20 | 20 | 20 | 0 | 0.167 | 1111110 | 0.12 |
| Layer 3 | 0 | 10 | 10 | 10 | 10 | 10 | 0 | 0.333 | 0111110 | 0.05 |
| Layer 4 | 0 | 0 | 10 | 10 | 80 | 10 | 0 | 0.5 | 0011110 | 0.04 |
| Layer 5 | 0 | 0 | 80 | 80 | 80 | 0 | 0 | 0.667 | 0011100 | 0.24 |
| Layer 6 | 0 | 0 | 80 | 0 | 80 | 0 | 0 | 0.467 | 0010100 | 0.16 |
| Layer 7 | 0 | 0 | 0 | 0 | 320 | 0 | 0 | 1 | 0000100 | 0.32 |
| Total | 30 | 40 | 210 | 130 | 530 | 50 | 10 |
Using the weighted average, we get a level of agreement of 0.61. The outlined procedure can be applied to any ordered frequency distribution.
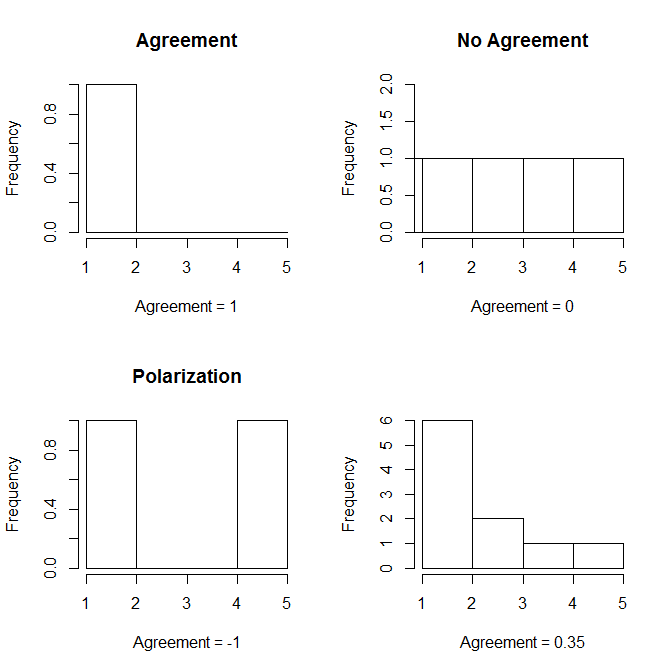
Levels of agreement range from -1 to 1. There are three ideal-typical positions that help interpretation. If all respondents agree on the category (position), agreement is 1. If the respondents are evenly spread, and each category has the same number of responses, agreement is 0. If respondents are divided, and half the responses are in one extreme category, and the other half are in the other extreme category, agreement is -1. In the figure, I also included an example between these ideal types. Agreement is only defined if there are at least three response categories, and it does not tell you which of the categories is the most common one.
Going Further
For further documentation, please refer to the original contribution by van der Eijk (2001), and refer to the package help files and vignette. You may also consider the other measures of agreement or consensus available in the package, such as Leik's measure of ordinal dispersion (Leik), Tatsle and Wierman (consensus), Blair and Lacy (dsquared, lsquared, BlairLacy), Kvalseth (Kvalseth), Berry and Mielke's IOV (BerryMielke), or Garcia-Montalvo and Reynal-Querol (MRQ). A measure of polarization based on the van der Eijk measure is also provided.
Van der Eijk, C. 2001. "Measuring agreement in ordered rating scales." Quality and Quantity 35(3): 325-341.
Last update of this page 6 January 2023